ログイン
| 新規登録
アカウント情報
ログアウト
JP
EN
CN
お問い合わせ
HOME
受託サービス
人気なサービス
分子生物学
変異体/ライブラリー作製サービス
IVT RNA合成
オリゴ合成
ペプチド合成
CRISPR/Cas9 ゲノム編集
タンパク質発現
抗体作製
細胞株構築
CRISPR/Cas9 sgRNA及びcrRNA合成サービス
前臨床グレードプラスミド調製
mRNA合成サービス
TurboCHO™リコンビナント発現システム
GenTitan™遺伝子フラグメント合成
New
GenTitanオリゴプール
HDR テンプレート作成サービス
New
Cas12a (cpf1) crRNA 合成サービス
New
pegRNA 合成サービス
New
CRISPR/Casタンパク質
New
FLASH Gene
New!
遺伝子合成
New!
クローニングサービス
プラスミド調製
カスタムベクター構築サービス
ORF cDNA クローン
GenCircle dsDNA合成サービス
GenTitan™遺伝子フラグメント合成
New
遺伝子変異ライブラリー
変異体作製
ハイスループット点変異ライブラリー
高精度変異ライブラリー
ハイスループット用DNAライブラリー
mRNA合成
カタログRNA&LNP製品
Circular (環状) RNA 合成
Rush mRNA 合成
自己増幅型RNA (saRNA) 合成サービス
LNPパッケージング
mRNA QC 解析
カスタムDNAオリゴ
カスタムRNAオリゴ
GenTitanオリゴプール
SARS-CoV-2 RT-qPCR プライマー&プローブ
New!
NGS ターゲット増幅
TurboTide合成サービス
5営業日保証
カスタムペプチド合成
ペプチド ライブラリー
ネオアンチゲンペプチド
ペプチド修飾
AccuPep+ QC
gRNA 構築
CRISPR/Cas9 sgRNA及びcrRNA合成サービス
New!
Cas12a (cpf1) crRNA 合成サービス
New
pegRNA 合成サービス
New
HDR テンプレート作成サービス
CRISPR ライブラリー
CRISPRノックアウト 細胞作製
CRISPR/Casタンパク質
New!
微生物のゲノム編集
TurboCHO™ 組換え抗体生産サービス
TurboCHO™プラットフォーム
哺乳動物細胞発現系
バクテリア発現系
昆虫細胞発現系
安定発現細胞株開発
ポリクローナル抗体作製
ウサギモノクローナル抗体作製
抗イディオタイプ抗体作製
抗体作製サービス
抗体関連サービス
アッセイ用細胞株構築
CRISPRを用いた細胞株構築
COVID-19サービス・製品
New!
FLASH Gene
遺伝子変異ライブラリー
カタログRNA&LNP製品
カスタムDNAオリゴ
カスタムペプチド合成
gRNA 構築
組換え抗体作製
ポリクローナル抗体作製
アッセイ用セルライン構築
カタログ製品
Most Popular Products
CRISPR遺伝子編集
抗体・免疫検出
タンパク質電気泳動・ブロッティング
タンパク質精製
タンパク質・ペプチド
分子生物学
安定細胞株
細胞療法
製品資源・サポート
人気な新製品
自動プラスミド抽出装置
New!
COVID-19 関連製品
Claudin 18.2 タンパク質・安定細胞株
免疫チェックポイント抗体・タンパク質
Cas9 / Cas12a / Cas13a ヌクレアーゼ
GMP Cas9 ヌクレアーゼ
CRISPR sgRNA 合成
HDR ノックイン テンプレート
CRISPR 遺伝子編集キット・抗体
抗VHH抗体
抗イディオタイプ抗体
エピトープタグ抗体
ウサギモノクローナル抗体
一次抗体
免疫検出
IVD抗体
抗体製品検索
プレキャストゲル
細胞溶解物
タンパク質標準品
GenBox ミニ電気泳動槽
eBlot™ L1 タンパク質転写装置
eStain™ L1 タンパク質染色装置
タンパク質精製レジン
磁気ビーズ
磁気ラック
AmMag™ 磁気ビーズ
AmMag™ SA Plus 半自動装置
エンドトキシンの検出・除去
サイトカイン
成長因子
免疫チェックポイント
タグ切断酵素
ペプチド
タンパク質製品検索
自動プラスミド抽出装置
New!
レンチウイルスタイター p24 ELISA キット
New!
AAV2 タイター Caspid ELISA キット
New!
PCR試薬
DNA アセンブリ
IVT mRNA試薬
S. marcescens ヌクレアーゼ
ACE2 ・スパイクタンパク質細胞株
免疫チェックポイント安定発現細胞
Fcレセプター細胞株
GPCR 安定細胞株
細胞分離
細胞活性化
自動細胞分離
NEW!
手動細胞分離
NEW!
お問い合わせ
キャンペーン
製品FAQs
製品 COAs, SDS
チラシ&パンフレット
製品引用
人気な新製品
Cas9 / Cas12a / Cas13a ヌクレアーゼ
抗VHH抗体
プレキャストゲル
タンパク質精製レジン
サイトカイン
自動プラスミド抽出装置
New!
ACE2 ・スパイクタンパク質細胞株
細胞分離
お問い合わせ
技術情報
Technical Resource
Databases
バイオ インフォマティクス ツール
その他
遺伝子
ペプチド
タンパク質
CRISPR資源センター
抗体
プロダクト
ピアレビュー
分子生物学
ペプチド
タンパク質
個人情報保護方針
標準利用規約
Protein Purification Resins
磁気ビーズ
磁気ラック
AmMag™ Magnetic Bead
AmMag™ SA Plus semi automated system
Endotoxin Detection and Removal
サイトカイン
成長因子
培養肉製造関連
免疫チェックポイント
タグ切断酵素
ペプチド
自動プラスミド抽出装置
New!
レンチウイルスタイター p24 ELISA キット
New!
PCR試薬
DNA アセンブリ
IVT mRNA試薬
S. marcescens Nuclease
ACE2 ・スパイクタンパク質細胞株
免疫チェックポイント安定発現細胞
Fcレセプター細胞株
GPCR 安定細胞株
細胞分離
細胞活性化
自動細胞分離
NEW!
手動細胞分離
NEW!
オンライン注文
キャンペーン
製品FAQs
製品 COAs, SDS
チラシ&パンフレット
製品引用
遺伝子
ピアレビュー
分子生物学
個人情報保護方針
Protein Isolation & Purification
Recombinant Cytokines
PCR試薬
ACE2 / Spike Protein
細胞分離
オンライン注文
Endotoxin Detection & Removal System
アプリケーション
We Recommend
Life Science Research
Industries
Case Study
Gene and Cell Therapy
New!
Antibody Drug Discovery
New!
Synthetic Biology
Protein Biology
Plant Biology
Genome Editing
Synthetic Biology
Protein Biology
Plant Biology
Genome Editing
Protein Isolation and Analysis
Immuno-oncology
Western Blotting
New!
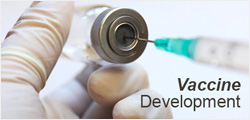
Vaccine Development
Immunotherapy
Drug Discovery & Development
SC2.0
Gene and Cell Therapy
New!
Synthetic Biology
Vaccine Development
SC2.0
リソース
Promotions
One Stop Solutions
Technical Resource Centers
バイオ インフォマティクス ツール
Learning Center
GenScript Reward Program
Reference Databases
Others
Service Promotions
キャンペーン
Biopharmaceutical Research and Development
New!
Molecular Biology Resource Center
Peptide Resource Center
Protein Resource Center
Antibody Resource Center
CRISPR Resource Center
Product Resources Center
Synthetic Biology Resource Center
Molecular Biology Tools
Peptide Tools
Protein Tools
Brochures & Flyers
Handbooks
News & Blogs
Case Studies
New!
Expert's Insight
New!
Research Digest
Research News Highlights
Service & Product Documentation
Webinars
GenScript Reward Program
Peer-Reviewed Citations
ORF and Mutant Clones
Antigen- Peptide Database
CRISPR gRNA database
Privacy Policy
Standard Terms & Conditions
Distributors
Biopharmaceutical Research and Development
New!
Molecular Biology Resource Center
Molecular Biology Tools
Brochures & Flyers
GenScript Reward Program
Citation Reward Program
Privacy Policy
IR情報
会社情報
グループ情報
会社案内
お知らせ
採用情報
Report Fraud and Corruption
Paperless Program
アクセス
グループ概要
Our Culture
Advisory Board
Our Commitment
Company Awards
For Academia
For Industry
Customer Testimonials
Press Releases
Latest Citations
Social Responsibility
Open Positions
Report Fraud and Corruption
Paperless Program
会社情報
お問合せ
グループ概要
For Academia
Press Releases
Open Positions
Report Fraud and Corruption
Paperless Program
会社情報
ログイン
新規登録
オンライン注文
Frequent requests
Your request is too frequent,
please try again later