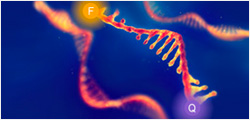
Figure 1. Dose dependent stimulation of intracellular cAMP accumulation upon treatment with NECA in CHO-K1/ADORA2A/Gα15 cells. d2 acceptor fluorophore -labeled cAMP (Cat. No. 62AM4PEC; Revvity) and intracellular cAMP in CHO-K1/ADORA2A/Gα15 cells competitively bind with Europium Cryptate-labeled anti-cAMP monoclonal antibody. The FRET signal decreases as the intracellular cAMP concentration rises and was measured by plate reader (Pherastar, BMG). The EC50 of NECA on CHO-K1/ADORA2A/Gα15 cells was 2.01 nM.

Figure 1. Dose dependent stimulation of intracellular cAMP accumulation upon treatment with NECA in CHO-K1/ADORA2A/Gα15 cells. d2 acceptor fluorophore -labeled cAMP (Cat. No. 62AM4PEC; Revvity) and intracellular cAMP in CHO-K1/ADORA2A/Gα15 cells competitively bind with Europium Cryptate-labeled anti-cAMP monoclonal antibody. The FRET signal decreases as the intracellular cAMP concentration rises and was measured by plate reader (Pherastar, BMG). The EC50 of NECA on CHO-K1/ADORA2A/Gα15 cells was 2.01 nM.

Figure 1. Dose dependent stimulation of intracellular cAMP accumulation upon treatment with NECA in CHO-K1/ADORA2A/Gα15 cells. d2 acceptor fluorophore -labeled cAMP (Cat. No. 62AM4PEC; Revvity) and intracellular cAMP in CHO-K1/ADORA2A/Gα15 cells competitively bind with Europium Cryptate-labeled anti-cAMP monoclonal antibody. The FRET signal decreases as the intracellular cAMP concentration rises and was measured by plate reader (Pherastar, BMG). The EC50 of NECA on CHO-K1/ADORA2A/Gα15 cells was 2.01 nM.
CHO-K1/ADORA2A/Gα15 Stable Cell Line
| M00246 | |
|
|
|
| ¥1,661,121.00 | |
|
|
|
|
|
|
| Ask us a question | |
